No-Kno's Representation Analytics platform scans a brand's ads, videos and social media content at scale with AI/ML technology and offers insights into opportunities for more inclusive marketing and more brand relevance.

No-Kno Representation Analytics Platform Modules
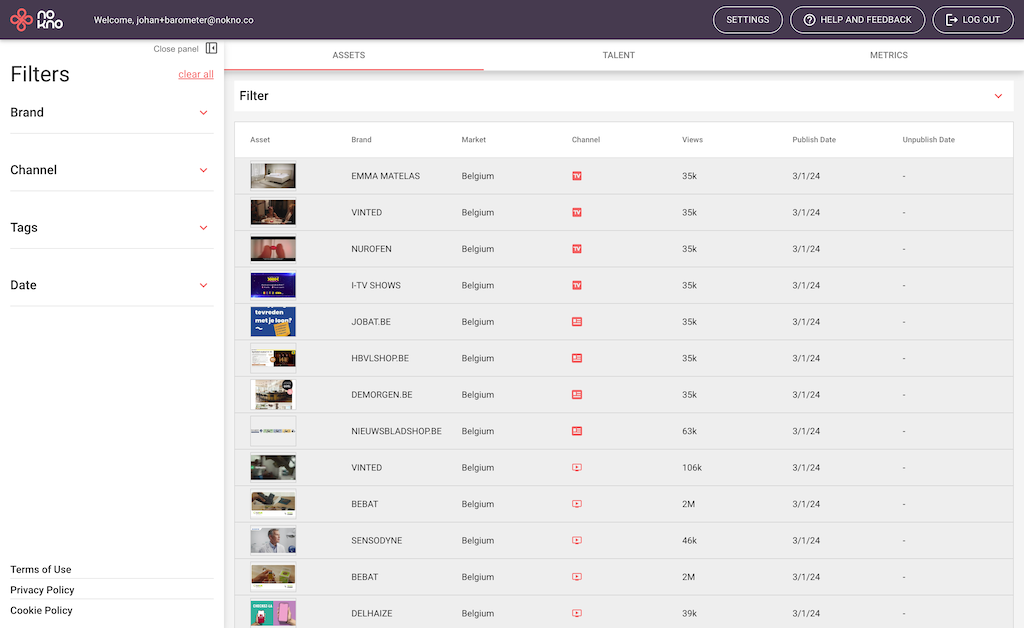
The No-Kno Representation Analytics platform continuously scans all your communication channels, providing a dashboard that offers insights into how well you represent your target audience.

Connectors
Paid Media
Social Media
Website content
Email
TV
Print

Analysis pipeline
Image, Video and language analysis
using ML/AI
human-in-the-loop

Dashboard
Insights into diverse representation:
Age
Gender
Disability
Stereotypes
Disability
No-Kno Platform Features
Measure
Map representation of age, gender, ethnicity, and intersections thereof in your marketing assets.
Compare
Compare diversity of brands, channels, timeframes, campaigns, markets, content topics, roles
Compare diversity in casting versus delivered impressions
Benchmark
Benchmark against your target audience demographics
Benchmark against competitors or industry
PIONEERING DIVERSITY ANALYTICS WITH 200,000+ DATA POINTS FROM